The Humble Burn Up
The little chart trying to make software delivery a little more predictable.
This article is based on a YouTube video. Check it out!
Non-Deterministic Non-Robots
Though it may occasionally seem like it, software developers are not robots, and software delivery is not deterministic.
In all likelihood, every conversation with the product owner or a subject matter expert or the stakeholders will reveal something. Requirements that were assumed to already be known, and spontaneous new ideas; unforeseen must-haves and tantalising nice-to-haves. The potential for scope-creep awaits at every turn, and this is just one of many factors making software delivery unpredictable.
- Varying skill levels.
- Surprise technical challenges.
- People taking vacations.
- Unexpected personal distractions.
- People getting sick.
- People getting bored.
- Fluctuating team morale.
- People arguing about politics.
- Twitter wars.
- HR intervention.
- Prolonged stress leave.
- Attrition and new-hire onboarding overhead.
- ...
Until Artificial Intelligence can produce more than just a regurgitated FizzBuzz solution, it's up to us humans to do the work. We do so at mere mortal speed, and - bound by other mortal concerns like time and budget constraints - a very important question is inevitably raised.
The Essential Question
Are we going to finish on-time and on-budget?
The unprepared Lead Developer will, depending on their level of self-confidence, either state matter-of-factly "We don't know".
Or, in desperation, they'll blurt out some random, finger-in-the-air estimate, hoping that it satisfies their imagined expectations of the inquisitor.

Or perhaps they'll simply deflect the question over to The Project Manager, who'll hastily open up an Excel spreadsheet containing a constantly changing Gantt Chart - a boundless, disorienting abyss of confusion, uncertainty, and despair.

Of course it's better to say "I don't know" than to commit without confidence, but if your job isn't just pushing pixels around or writing for loops, and you're actually responsible for ensuring the successful outcome of your project, the need to answer this fundamental question is not something that can be ignored.
The good news
If cost is simply a function of time and salaries, then answering the "on-time" part gets you most of the way to answering the "on-budget" part.
The bad news
Answering the "on-time" part is a function of a miscellany of complex parameters that are hard to identify even in the moment, let alone predict in the future.

Thankfully, there's a way to answer the question with confidence that grows over time, and without knowing all the unknowns. And, no, it's not Waterfall.
Instead of desperately clinging to the notion that computer programmers can accurately estimate vast amounts of technological and anthropomorphic complexity up-front, this method is rooted in the incremental observation of objective reality, measured at regular intervals, with a "past performance indicates future performance" philosophy that's about as accurate as all but the most clairvoyant among us is going to get. At least in my experience, anyway.
Past performance indicates future performance.
The key word is "indicates". This isn't a guarantee. More a prediction based on previous outcomes applied to knowable future circumstances.
The humble Burn Up chart
A burn up chart is a simple visualisation plotting work completed against work remaining, over time. Its main purpose is to extrapolate past performance into the future. This extrapolation can be used to derive the team's "velocity". The reliability of that projection depends on the extent to which foreseeable circumstances are accounted for. Read (a lot) more about velocity.
An Example
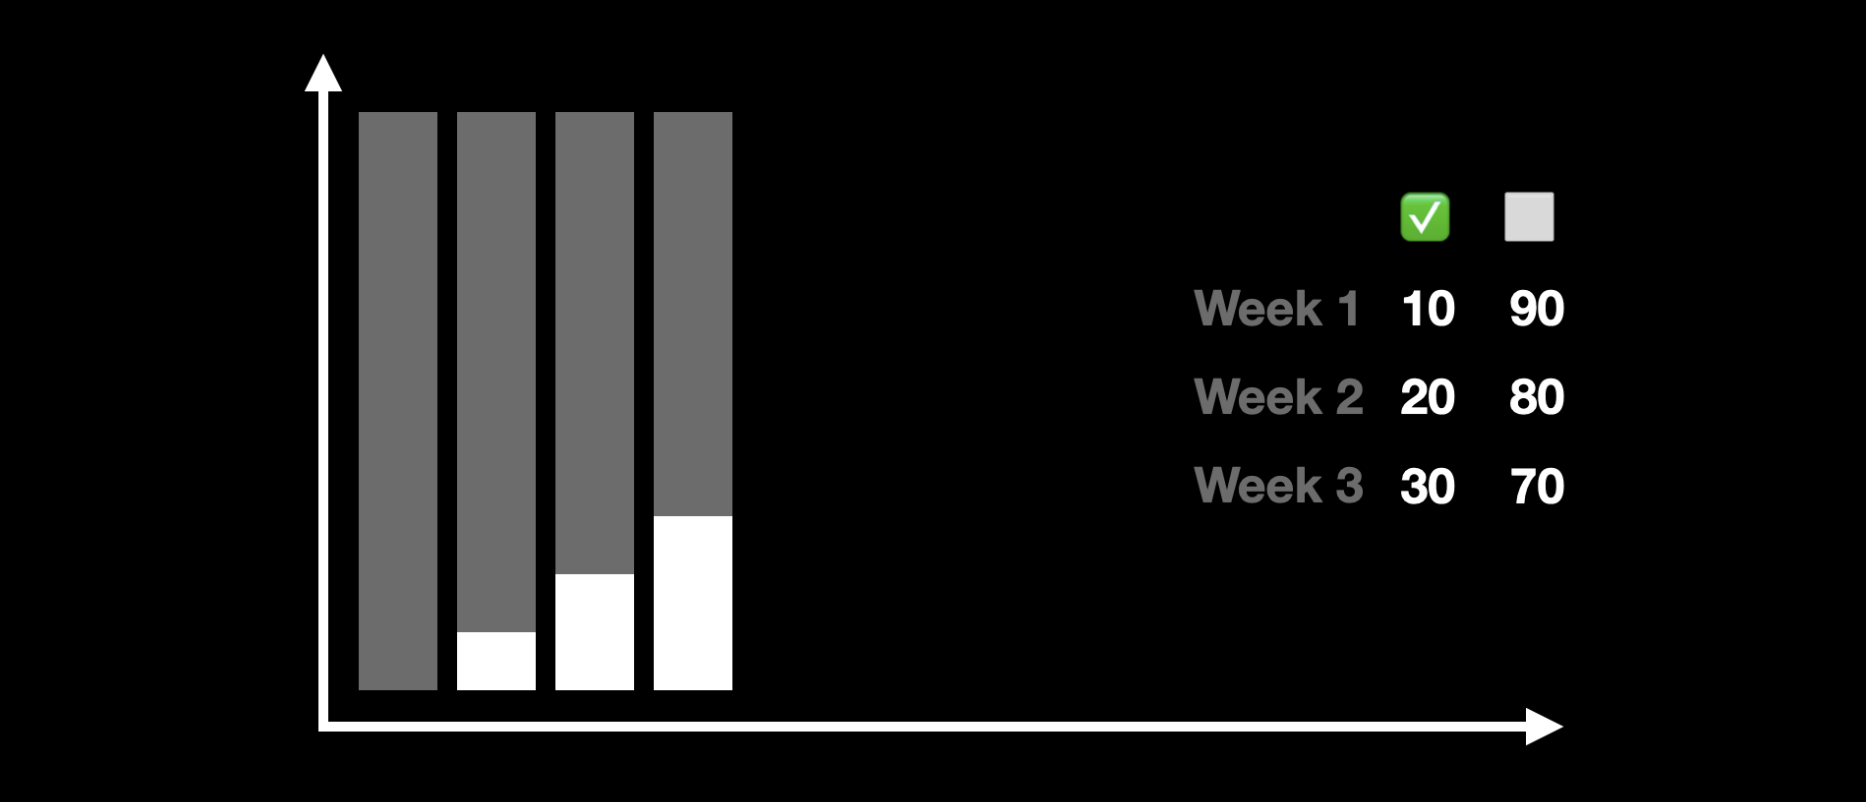
Assuming you estimate in Story Points (you should), and your team is remarkably consistent, yours might look something like this:
- Starting with 100 story points in the backlog,
- 10 points completed in the first week, 90 points remaining,
- 10 points completed in the second week, 80 points remaining,
- 10 points completed in the third week, 70 points remaining.

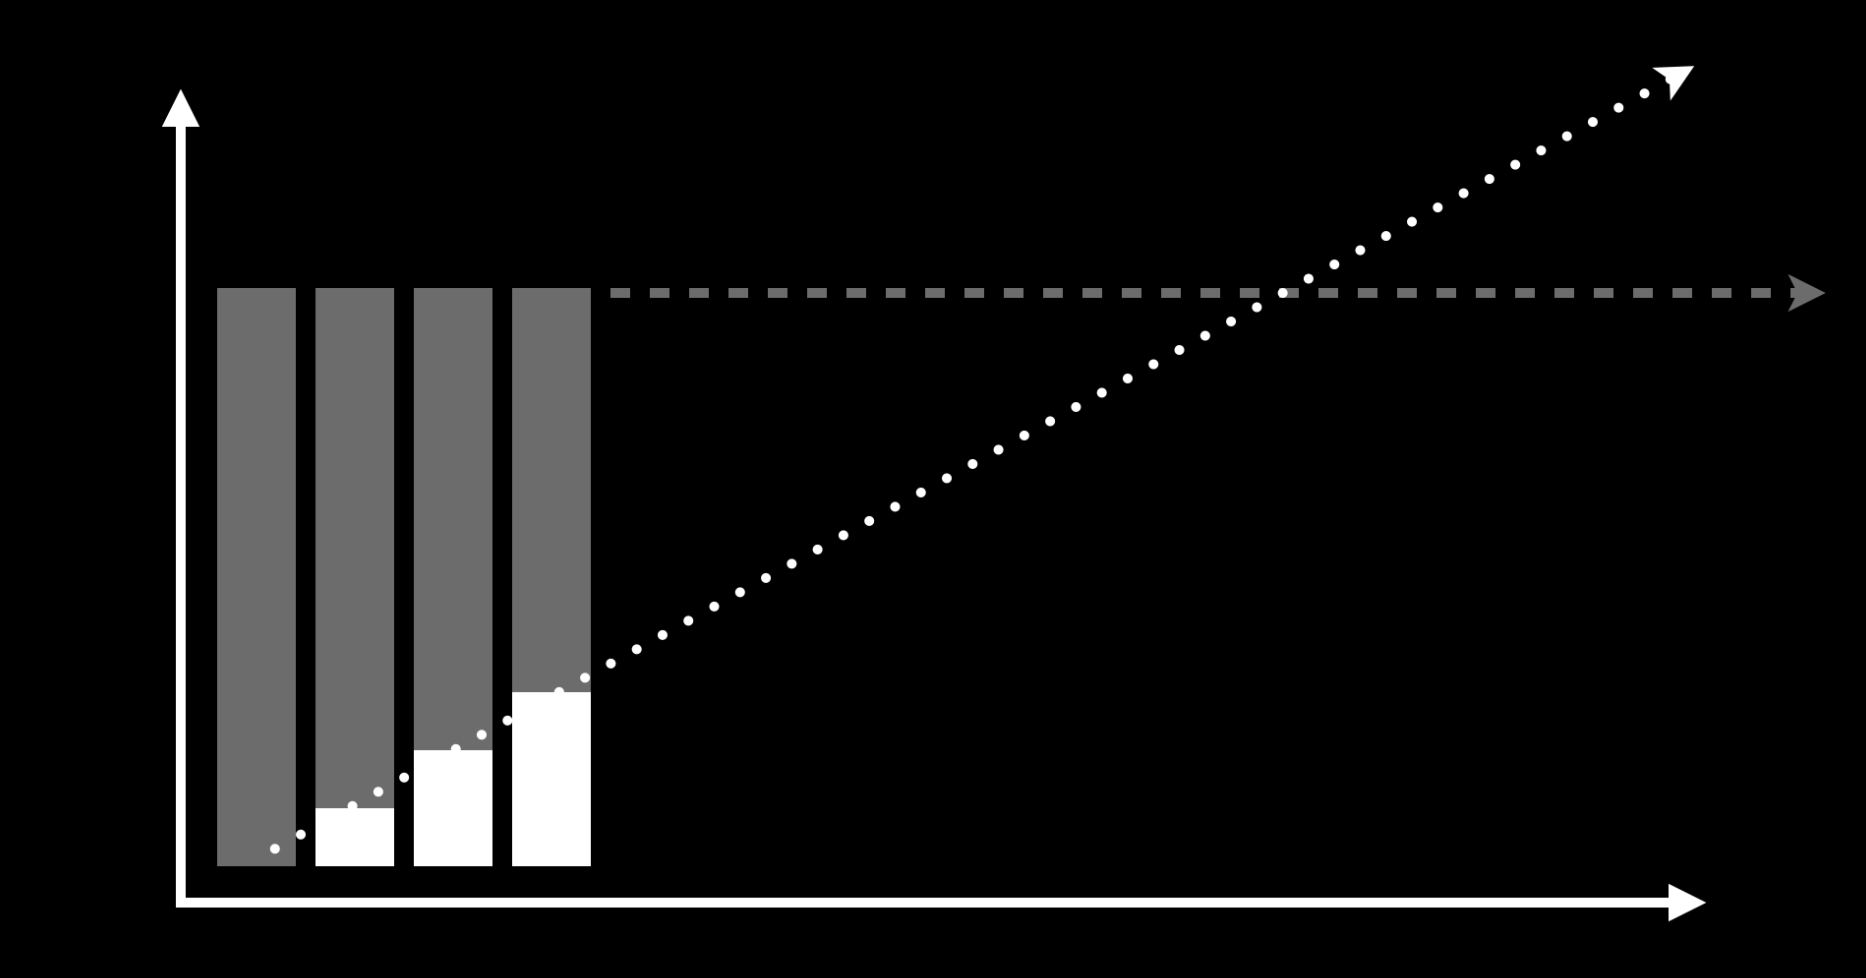
These two measurements can be extrapolated to produce trend lines which help predict the future.

Where the two trend lines meet is the current best guess at a completion date. I say "current" because...
Things Change
We've already noted that a variety of different factors make software delivery unpredictable. An array of variables influence the team's output. On top of that, the todo list likely doesn't remain static either.
As work is completed, ideally the remaining work shrinks accordingly, but sometimes - because of scope-creep, legitimate new requirements, estimation adjustments, etc - the remaining work might increase. On the flip side, as expert scope-negotiators weasel their way out of more and more work, or as changing business priorities dictate, the scope of remaining work might decrease too.
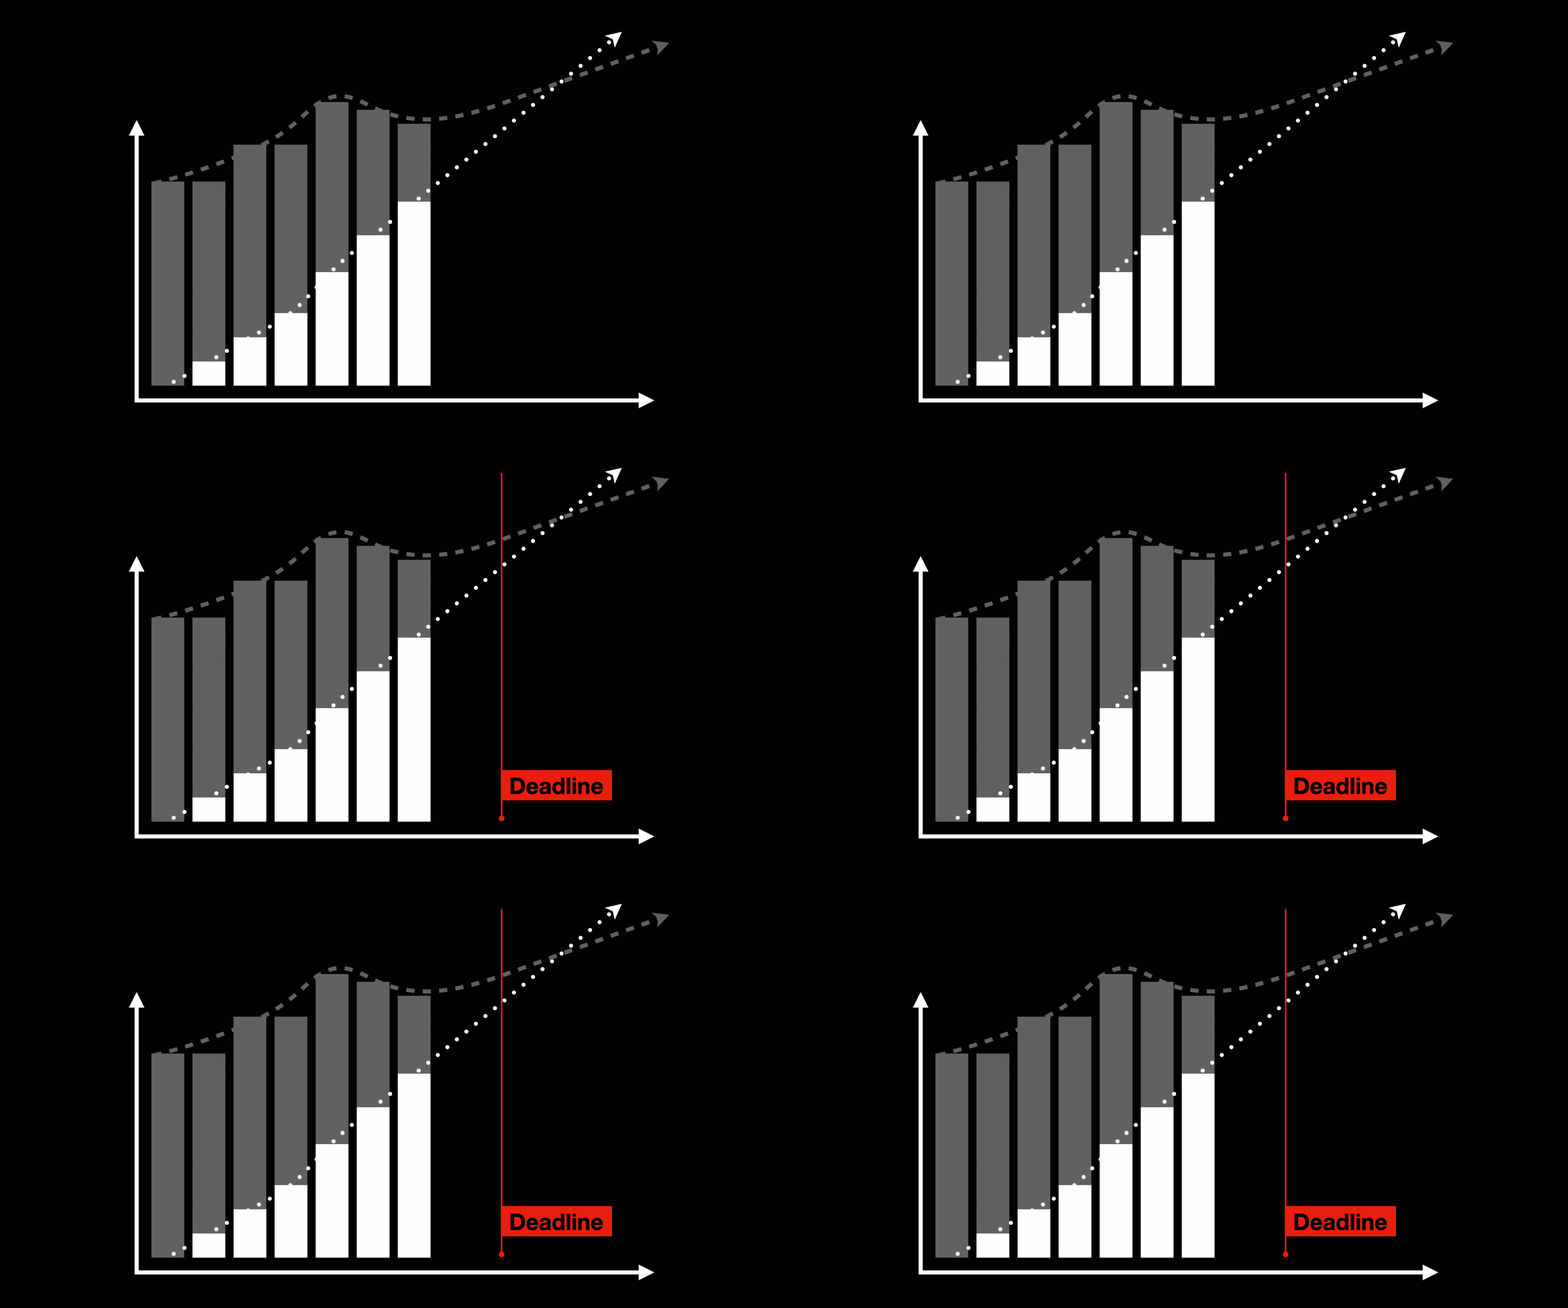
Even if the rate of change in output and scope is high, a decent burn up chart can factor that in with a moving average on work completed and a moving average on work remaining.
The two trend lines either intersect or they don't. If they don't intersect, the project will conceivably go on forever, and the answer to the essential question is probably "No".
If the lines do intersect, the answer depends on where the lines intersect. Is it before or after the due date? Before or after the time at which the budget runs out?

Regardless, observing the objective truth will help a good project manager make informed decisions about things like scope-management and team composition. A burn up chart can be a great visualisation to help stakeholders understand that changing scope reduces the certainty of delivery within constraints - a great negotiating tool.
Generally speaking, these changes in output and scope are nothing to cry about. With the right tools, it's just another picture of the past that helps paint a picture of the future.
The Tools
There's a good chance your Project Management Suite of choice is capable of producing some kind of trajectory visualisation. Either it's an out-of-the-box feature or it's an extension - maybe a micro-transaction - whatever. I'd say there's a good chance these options are sufficient.
However, a few problems may present themselves.
Restrictiveness
Sometimes, the charting capabilities in these tools impose certain requirements on the rest of your practices. They might be dependent on the way your backlog is structured, or the way your teams and sprints are organised. Whatever it is, if it imposes some restriction on how you do things that just doesn't work for you, you have to choose between convenient reporting and comfortable execution. When you're trying to focus on shipping features, fighting your project management tools is a very demotivating distraction.
Reductionism
Another problem is that the charting capabilities are often overly simplistic, failing to account for at least some of the nuances of the profession, reducing the measurements down to "Average Points per Sprint" and extrapolating that over time. It's better than nothing, but when you're dealing with stakeholders who like to interrogate the minutiae of your claims, this kind of reductionism doesn't cut it.
So, what do you do?

MVPM Tools
I'm building a free toolkit to help turn any individual contributor into what I'm calling The Minimum Viable Project Manager. The goal is to eliminate as much of that unnecessary middle management interference as possible. Starting with the world's most unimpressive project burn up and some basic budget monitoring, MVPM Tools is here to help you succeed where so many others do not.
The year is 2022 and, despite the uprising of professional Agile Coaches, Scrum Masters, and Project Managers parading about on LinkedIn, too many software projects still fail due to mismanagement. Too many 1ups pointing at their Gantt Charts, cracking whips, commanding their team to "just build faster". Too many burnt out software testers, designers, and developers trying to explain "It doesn't work like that".
MVPM Tools is part of a larger initiative to ubiquitize management & leadership skills among typical software delivery professionals. I'm hoping this results in more successful projects and an overall less wasteful (most sustainable) industry.
So head on over to mvpm.tools and check out the very work-in-progress early stages.
Check the YouTube video at 6:39 for a whirlwind "get started" walkthrough of creating a project and drawing some bars and lines.
Feedback wanted!
I'm keen for any and all feedback, so please give it a go and don't hold back.

👋 Thanks and farewell!
