Vexatious Velocity
Over-complicating "speed and direction" so we can under-complicate it later.
Almost every team observing some form of agile development (whether true to the Agile Manifesto or not) will be measuring "velocity". Without casting too many aspersions, I've found a lot of teams fail to settle comfortably on the "what", "why", and "how" (maybe even the "when") of velocity tracking, often confusing or conflating it, or simply neglecting some of the key parameters that go into calculating something meaningful.
So, here's my attempt to over-explain it into a state of clarity with my thoughts and opinions.
Keen to circumvent my self-indulgent lyrical opus?
Otherwise...

A Half-Decent Physics Analogy
In physics, Velocity is simply a vector describing Speed and Direction - for example, how fast a car is travelling along a straight, flat road. Easy! However, like many simplistic models, it is inadequate to describe the bumpy ride of software delivery, which feels a lot less like smooth automotive travel along a pristine highway and more like pushing a shape-shifting boulder up and down unsteady terrain with a group of friends.
Some of those friends are helping you push. Others are refining the optimal pushing technique, "refactoring" the approach as you struggle to maintain a consistent pace. Others are redefining what the boulder is, perhaps over-ambitiously adding mass or maybe even pragmatically subtracting some for greater ergonomy and aerodynamism. Then there's the person with the map. Perhaps they are steadfast in their direction, unwilling to take risks but confident in eventual success... Or perhaps they'll strategically trade brief uphill struggles for some later downhill respite... Or maybe they're leading you in circles - unable to commit to a path - in what (to drag another software delivery metaphor into this analogy) feels like a death march.
Everyone's "working" but not everyone's "work" is to push the boulder - and if you tried to do it without those people, would you go faster or slower? Indeed, would you ultimately succeed?
In fact... what is success?
🤔 "Why are we pushing the boulder?"
A great question - essential, even - but for the purposes of this article it's mostly irrelevant... This boulder's gotta go somewhere, and you're the one who has to push it. Deal with it. The real question, then, is "Where to?"
😫 "When are we going to get there?"
This is the question on everyone's mind, and rightly so. To answer it, you'll need to know a few things...
- What is the destination?
- Where are we relative to it?
- How long (and bumpy) is the path?
- How fast can we go along it?
So many questions already, and yet here's another one before we answer any of them.
Why Measure Velocity?
The boulder is heavy. You've only got so much energy, and the sun is going down. You can't just keep rock'n'rolling forever.
Delivering software is expensive. Even the richest person in the world could burn through all their Bitcoin on a poorly-managed software project, and it's typically the case that the financial budget is significantly tighter than infinity. So too is the time budget. At best, the lifespan of human ambition (unless shared across generations) is the lifespan of that human - on average, 73 years. This might be sufficient for the Entmoot of Government enterprise, but for those competing in free-market capitalism, or in the throes of some emergency, time is almost always of the essence. Snooze? Lose.
The question that ultimately needs answering is:
Are we going to deliver what we need to, on-time and on-budget?
If you're to drive a car down a straight, flat, empty road, you can be fairly confident before even getting behind the wheel how long it will take. Enough fuel in the tank for a determinate "Litres per Kilometre" rate of expenditure, and some simple Time = Speed x Distance arithmetic will largely suffice. Vroom-vroom, as they say. 🧐
Given the indeterminism of software delivery, the question needs to be asked and answered frequently to maintain confidence. Each time, the answers will probably be different, so the best we can do is aggregate and intuit patterns to predict the future (however imprecisely).
Remember: You're pushing a shape-shifting boulder up and down unsteady terrain, and few factors are constant.
One day you're Hercules, the next day you're curled up in the fetal position with DOMS. Human productivity changes daily - hourly, even minutely. An insensitive email and the ensuing passive-aggresive back-and-forth; some bad news from abroad; a sudden headache.
Even the path itself is changing. In a truly agile environment, the path is determined by the (perhaps fickle) market. In a more closed system, the path will likely be set out by some initial ambition and (ideally) later repaved along some vector of feasibility.
Doomed projects are characterised by the inability to accept and respond to the uncertainty and dynamism of the profession. What does that look like?
💰 If you've over-committed against your budget...
You may need to cut down the scope.
⏳ If you're building too slow for your time constraints...
You might consider adding more people or (again) cutting scope.
Beware the Mythical Man-Month.
❌ If you've discovered you're building the wrong thing... You can stay the wasteful course towards embarrassment, or pivot and - time permitting - salvage something of value.
💀 If the project is looking like an inevitable failure...
Maybe cut your losses and put the remaining budget to better use.
The worst position to be in (or the one with the fewest options) is one of ignorance. You limit your capacity to make informed decisions that will save time and/or money, or avoid abject failure altogether. Sure, you could be clairvoyant and simply "know" you're going to succeed; You could be a Government enterprise with limitless (tax-payer) funding, operating on a timescale inconceivable to mere finite mortals, with no accountability to deliver anything in anyone's lifetime; You may contently regard time and money as "no objects", happily meandering about an infinite winding trail of unresolved ambition. But...
The rest of us operate in a reality where constraints abound, where outcomes are paramount, and it's important to know if and when we'll achieve those outcomes.
So, y'know. That's why we measure velocity.
So what even is Velocity?
Velocity is Speed and Direction, but both of those components are static values measured retrospectively. How fast were we travelling? Which direction were we going? On the straight, flat, empty road, the automobile could maintain those values (roughly, diminishingly) into the future through Newton's First Law of Motion. The same is not true for software delivery. There is no inertia. You can't coast on your previous successes.
The reality is that velocity is rarely constant in software delivery. The reason is that its components (speed and direction) are subject to innumerable influences. Anticipating and incorporating change into the equation is key. A thoughtful understanding of the Speed and Direction components will allow you to reason about (and overcome) challenges relating to progress tracking and prediction in your boulder-pushing endeavours.
Velocity is a measurement, not a goal. Neither is it a promise. It's past performance indicating future performance, with no guarantees.
Teams that try to commit to achieving a certain velocity are likely either limiting or placing undue anxiety on themselves.
We really should be aiming for a velocity of X.
☝️ Avoid this. Until the software-delivery-mobile comes with an accelerator pedal, attempting to standardise on a certain velocity will result in shame and disappointment (neither of which improve speed or direction). It's also easily gamed (just use a bigger baseline).
Think of velocity more as a fact you learn in retrospect, measured regularly (every week or two), and which informs new predictions about the future every time. In a healthy project, those predictions fluctuate minimally. In an unhealthy project, the fluctuation is a cry for help. Better do something about it.
Learn to embrace the objective truth as it is presented to you (not as you wish to perceive it) and you will more confidently walk an illuminated path towards your destiny. 🧐
❌ Can we predict the moment the last feature will be shipped to Production? No...
✅ We can determine in advance if we're likely to finish early, on-time, or late? Yes!
What you do with that information is up to you.
And with that, we descend into the first rabbit hole.
Direction
We're starting with direction because it implies distance, and distance is the most significant, IMHO. If distance was zero then you could move as slowly as you like and still succeed... instantly! If distance was infinite, you'd be going nowhere no matter how fast. Yes, I know the inverse is also true, but it's also first up because without defining distance I struggle to meaningfully discuss speed. Okay? So, here we go.
Any Mathematics PhD could tell you that distance is the amount of space between two points. But, like... what does that mean?
In Cartesian coordinate space we're dealing with real numbers along two dimensions. To make sense of those numbers, we might assign some unit (i.e. anything from the very sensible metric system, and absolutely nothing from the imperial). We might say the distance between A and B is 3cm. 👌 Yeh? Cool.
In Software Delivery space, it's far more abstract - less intrinsically quantifiable. For our purposes, we're measuring from:
The features we've delivered so far.
The hypothetical end-state where all features comprising the project goal are delivered.
The project goal is also when we get to take a holiday. Or, y'know... Maybe pay off some tech-debt.
Identifying the goal can be tricky. Much of the artform that is software delivery is in defining the goal (and wrangling stakeholder expectations around it). The goal must represent the need, but it must also be feasible. Any remotely disciplined team will be representing the goal deconstructed as a (somewhat) linear sequence of deliverable chunks called "User Stories" or "Backlog Items". This linear sequence of deliverables is known as "The Product Backlog" (or just "the backlog"). It's a glorified to-do list.
Each user story is typically estimated in relative sized "Story Points". Ideally, the entire backlog is estimated at all times. The estimates needn't be final. User stories can be re-estimated and/or further deconstructed for a variety of benefits, none of which I'll cover right now. The point is, even a very roughly estimated backlog provides an indicative "topological view" which helps answer the "How long (and bumpy) is the path?" question.
Your backlog might look something like this:
- Sign up page. 20
- Sign in page. 8
- Ability to watch cat videos. 20
- Ability to comment on cat videos. 13
- Encourage doom-scrolling. 5
Names on the left, story points on the right. The order determines the priority, because - in a world of temporal and budget constraints - we can't always do "everything", so we wanna do the most important stuff first. 👍 I'll elaborate on this later.
Our coordinate space is the one-dimensional backlog. Our unit is the story point. Point A is the beginning of the backlog (or wherever we are along the completion thereof). Point B is either the end of the backlog or some meaningful point along the backlog representing the current goal. The distance between the two points is the sum of the story points assigned to the user stories in that range. Easy.
The distance between the start of the project and its completion is 66 story points. Vague, for sure, but so is a kilometre or a lightyear or a parsec without the additional context of speed. 🤷♀️ We'll get to that, but first let's cover off the situation where that 66 becomes a different number.
Elastic Backlog
As anyone who's tried waterfall would have painfully learned, "things change" in software delivery. Complexity is often lurking below the surface of even the most trivial user stories. Maybe you underestimated the task of client-side validation, or you failed to consider the architectural implications of a certain long-running query. Perhaps the business has been operating on hidden rules that exist only in the minds of a handful of employees who surprise-attack you with "Actually, that won't work because...". Heart-breaking, but it's not all bad news.
On the flip-side, there are opportunities to simplify that which might be overly ambitious or unnecessarily complex, or to put low-priority functionality "on the back-burner". Can you de-prioritise client-side validation and rely on the server to police the domain? Perhaps the long-running query could be run routinely in a background process and pre-populate some in-memory caching layer, "just for now". And perhaps a conversation with those veteran employees will spark a design epiphany, streamlining the entire UX down to a single interaction, saving weeks of development. Sweet!
Splitting out and re-prioritising backlog items based on complexity and necessity, compromising on nice-to-haves in order to deliver must-haves, re-evaluating the solution in light of new information, and consolidating parts of the solution to simplify the implementation - these activities are common in successful projects. As they occur, the backlog shrinks and grows.
This is the path between Point A and Point B changing, and it happens roughly as often as the backlog itself is discussed, or whenever you seek user-feedback. It's a good thing, or - at least - it's better than stubbornly (or ignorantly) building the wrong thing. #waterfall
An evolving backlog is a sign of growing understanding of the problem domain. It's the transfer of energy between developers, designers, product owners, subject matter experts, and the rest of the gang. That energy flows into the software and makes it better than it would otherwise have been. More "correct".
A backlog that doesn't change smells a lot like upfront design. 💩 #waterfall #again
To Infinity...
So, given the backlog shrinks and grows, you could conceive of a scenario in which the rate of growth escapes feasibility.
Not to encroach on the upcoming dissertation on Speed, but if your backlog is growing at a rate of 10 points per sprint then you'd better be building faster than that. Otherwise, you can't be sure you'll ever finish. This is effectively the "infinite distance" I spoke of earlier, where it takes all the running you can do to stay in one place.
Drawing a Line...
After all this rambling, maybe it's still not clear how we wrangle distance. Even if you de-prioritise work, it still exists on the backlog. Unlike Bitcoin, ideas are cheap and unlimited. Once you open the "we're open to any feedback" floodgates, the backlog is routinely topped up with this and that. Infinite distance problem again.
This one's easy. Just draw a line in the backlog. I usually represent this as a backlog item to allow for easy re-arrangement.
- Sign up page. 20
- Sign in page. 8
- Ability to watch cat videos. 20
- Ability to comment on cat videos. 13
- ⚠ The Line.
- Encourage doom-scrolling. 5
The line can represent whatever cut-off you want to draw in your backlog. Perhaps it's the MVP, where items above represent the bare minimum must-haves, and those below are nice-to-haves. That's a good start.
In an ordered backlog where higher-value items are above lower-value ones, you never have to feel regretful about where your attention goes. You're always focusing on the most important thing, per your current understanding. In light of that, the line can also be a useful tool in communicating with the Product Owner (and other stakeholders) which items are going to make it and which items are not. If time is running out, the line might represent the extent in the backlog to which you believe you can reliably deliver. It often makes for a good bargaining tool when negotiating on scope and priority. "If we move X up then Y falls below the line. If we reduce the scope, we might be able to do both."
Wherever the line is, it's Point B - our destination.
So, will we get there in time?
Speed
We have a backlog. We can see where we're going and roughly how long the path is, and we've thoroughly enjoyed writing out all that acceptance criteria. However, our job isn't to build backlogs. It's time to start building software. Clock's ticking! GO!
Speed is easy to calculate.
Speed = Distance / Time.
But, uhh... What exactly is time? 🤔
That's right. We're deconstructing Time now!
😆 Just kidding.
😏 Although...
Story Points Per What?
We do need to settle on at least one thing when measuring speed. What unit of time are we measuring in?
A very simplistic approach to calculating your speed would be to take your story point completion rate per sprint. You can project that across future sprints to arrive at a pretty decent starting point, and - honestly - if you only did this, you'd still be better off than many.
Take our example backlog of 66 story points from earlier. Let's say we're 3 sprints into the project and our achievements so far look like this:
- Sprint 1 - Completed 6 story points.
- Sprint 2 - Completed 7 story points.
- Sprint 3 - Completed 5 story points.
The (mean) average achievement is 6 story points per sprint. Looks like an open-and-shut case.
Time = Distance / Speed
or
66 Points / 6 Points Per Sprint = 11 Sprints
Give or take...
But then this happens...
- Sprint 4 - Completed zero story points.
😱 "I told you we should just estimate in hours! All this story point stuff is useless. You're the worst project manager I've ever met. I hate you!"
Whoa. Settle down, hypothetical highly strung contrarian. It's fine. Maybe the team took a holiday. Maybe they were briefly deployed to another project. Such things are rarely a surprise. Christmas happens at the same time every year. A well-run company typically doesn't churn so much that no one knows where they'll be one week from the next. You could possibly have seen this empty sprint coming from 20 story points away. 😏
Now, let's say it really is the case that the team was fully committed to the project but completed no backlog items this time. No big deal, really. The new average velocity is 4.5. Embrace the truth. See how it fares against your constraints. Manage accordingly. Besides, there's a good chance they made decent progress on whatever they were working on and will finish it off (and then some, balancing out the numbers) in the next sprint. Maybe.
But what if the team actually wasn't fully committed to the project? What if the zero point achievement was actually due to reduced availability?
Let's look at the extreme scenario first, and suppose the whole team was absent for the entirety of the sprint. Obviously it doesn't count, right? Assume the team is coming back next sprint and they'll continue to work at a roughly 6-points-per-sprint pace. There's little value in compromising our predictions based on this one little anomaly. Maybe.
If this anomalous distraction was, in fact, a total surprise, and such surprises are endemic in your organisation, then you might need to let this "churn factor" persist in your calculations. Maybe responding to organisational crises is 25% of "business as usual". The good news is that averaging out data naturally accommodates such repetitious circumstances (it's kind'a the point). You don't have to do anything. Over time, the average washes out to roughly 3/4 x Story Points Per Fully Committed Sprint.

Over a long period of time, the net effect of this on prediction is diluted and increasingly negligible. This is half the point of averaging. On a shorter project, it's different. The value of aggregation is proportionate to the sample size. Less data, less indicative. Anomalies skew the results more significantly. We'll get back to this later. For now, recognise that you can either absorb the anomalies over time or discount them altogether, depending on how they're best categorised. 🤷♀️ The former is low effort. The latter requires cherry-picking of data. Boring! Do not want.
Now, what about the situations where some but not all of the team was available? Let's say half the team was on-duty while the rest were on leave. Now we have a much more mathematical problem.

If you can account for some achievement in sprint 4, then you have some information to work with. Let's say you split out some backlog items and determine that the team actually did acheive 3 points. That sounds about right. Half the team, half the usual achievement... Great. But we're not really working with a "Per Sprint" unit of time anymore. We're working with fractions of a sprint.
The new speed is 3 points per half-sprint. It's not wrong, but, uhh... Where do we draw the line on this fractional representation? What if we have a few quarter-sprints? 🤔
We're currently moving at 4.666666 story points per 0.3333333 sprints. This is a great achievement. Well done, team. WAGMI.
Yeh, nah. Let's pick something else.
Hour Power
I like to use hours, rounding up to whole numbers. 🤷♀️ I've also used days (and fractions thereof) but I've found that hours provides more granularity without sacrificing convenience. If someone works a few half days here it can be captured in hours with about as much effort as with days (arguably less).
i.e. Typing 4 vs 0.5 for a half-day.
For me, a standard work week has typically been 40 hours. If yours is 38, that's gr8 m8, but I'd suggest that tracking fractions of a 7.6 hour day might amount to "splitting hairs". This is another one of those "it all comes out in the wash" situations.
As long as you're consistent, it's (mathematically provably) irrelevant.
Commitment
So, we've decided to measure speed as "Story Points Per Hour Worked". We have a reasonably high-resolution backlog with user stories not too big nor too small. Now we just need to keep a reasonably high-resolution record of hours worked by the team.
This can get tricky, and there are dragons within. Perhaps even scary HR dragons...
Working As Expected
For some people, work is nothing more than a means to an end. That's fine - healthy, even. If they won the lottery they'd be gone tomorrow, but they're also honest people who work diligently and consistently.
Love those people! They make this easy. Every day is 8-hours of solid "gettin' it done". A handful of coffee breaks and few "where did the time go" rabbit-hole conversations about how Star Wars isn't what it used to be, but this stuff really does come out in the wash.
Overtimers
Then there are the people for whom work-life balance is a foreign concept. They'll do half a day's work before the rest of the team is even out of bed, and continue pumping out code well into the evening. A 12-hour day is the norm for these people, despite best efforts to encourage getting outside a bit more, or learning their childrens' names. Each to their own, I guess. My only qualm with this is when the overtime is:
- Not captured, and
- Wildly inconsistent.
Most of the people I've worked with who over-commit like this are shamefully dishonest about it. You take a look at the git log and notice some alarming timestamps.
🤔 "How long were you working yesterday?"
😅 "Oh, not long. I finished up a bit late but it's nothing."
Turns out they were committing code for 16 hours straight. Putting the health concerns mostly aside, it's necessary to note that - for most people - this is not sustainable. One week they're doing 16 hours of hyper-productive code-smithery, the next they're burnt out and only managing a fraction of their normal productivity within a standard 8-hour day.
This is hard to quantify, and it makes tracking "story points done per hour worked" difficult, because some of the hours worked are not accounted for, and others are drastically unrepresentative of usual productivity. 🤬
On the other hand, however, I recently worked with someone who, I swear, works even while they sleep but manages consistent levels of productivity. Luckily, they'd advertise their overworking pretty openly. Prying the truth out of these people is not necessary. They brag about it 😆.
Undertimers
Some people don't work 8 hours a day because they don't need to. 🤷♀️
I worked with someone who would knock off early sometimes because they'd outpaced the rest of the team by an order of magnitude and felt like they'd earned it. When someone's completing twice as much work as everyone else in half the time, it's hard to argue with that line of thinking (especially if the math doesn't extend proportionarely to their salary).
Some people, however, simply don't care. They might fall out of bed minutes after the daily stand-up begins, and dawdle through the backlog for an hour looking for excuses not to pick up a user story.
💁♀️ "This one's blocked because I don't know what this acceptance criteria means."
alt + tab over to GTA V for an hour or two and then it's off to the longest lunch break in the history of lunch breaks.
By the end of the day, there's a half-arsed git commit -m "WIP" in the repository with a few functions stubbed out and a sloppy first-pass at some UI code.
🤔 "How long were you working yesterday?"
😎 "All day, mate. Did you see my comment? That story's blocked so I picked up one from the bottom of the pile."
🤦♀️
I'm exaggerating, but I'm also (lamentably) not too far off an anecdotal experience.
These people aren't necessarily incompetent. If they were, they could be forgiven. Instead, they're just being lazy. They usually pick up their act when called out, accelerating to a vague semblance of adequacy for a while before an almost inevitable relapse into mediocrity.
These people, like the dishonest overtimer, also make tracking velocity difficult for a similar reason. One week, a purported "8-hour day" is really a 2-hour day with the maximum overhead of context-switching incurred. After some disciplinary action they might up their game - perhaps even over-compensating to catch up. Suddenly the same "8-hour day" is producing 10 hours (5x) of output.
This wild fluctuation is like the stretching of space-time around a black hole. Time dilation does not make for a trivial parameter when calculating velocity.
Time-Tracking Across the Universe
How much of this comes out in the wash? Hard to say. Everyone's different. The variance is the real problem. If everyone performed, over-performed, or under-performed consistently it would be fine, but they don't. Not only that but the truth is often hidden. It's impossible to quantify.
With all this in mind, I prefer not to leave it up to the law of averages and instead track hours worked per person.
And, yes - a rough guess is fine.
The Shocking Truth About Time
So how do you get someone to tell you if they've worked overtime? Or - more difficult - undertime?
Well. Good luck. It's hard. For me, it starts by explaining all this ☝️ and follows with gentleness, understanding, compassion, and all that other stuff technologists are renowned for... 😆
People need to understand why the truth matters, and feel like they can be honest without judgment. Make that happen first.
If someone's committing wanton acts of overtime, the work-life balance conversation is a separate one.
Similarly, if someone's under-committing, the performance-management implications should be a separate conversation. If that person is a high-performer, you might even want to re-evaluate your own preconceived notions about productivity. i.e. Does a person really need to work average hours if they're producing above-average output? I wanna say, no.
In the end, I just want the truth. I've heard it'll set me free.
The Future of Time
We can't be sure of how much distance we're going to travel in the future, but we typically have some certainty around how much time we're going to be able to commit. This is useful when predicting future speed, which is really what calculating Velocity is all about.
It's possible to know in advance how much time we're likely to work.
- Going on holiday in Sprint 5? Okay. You're a zero for that duration.
- Got surgery next Monday? You'll probably be out of action for a day or two.
- Wedding anniversary? Knocking off early? Sounds like a half-day.
Plotting out a tentative schedule for the team (even factoring in their propensity for over- and undertime) is a great way to reduce the number of unknowns when calculating velocity.
Past performance multiplied by future commitment will give a pretty good indication.
With that, I think it's time to come up for air...
Recap
We just took a deep-dive into Speed and Direction. That was a lot of rambling, even for me, and even I'm lost. Here's a short recap.
We understand distance and how to quantify it.
It's the size of the backlog at any point in time up to some threshold we're aiming to deliver. From Point A - The Software We Have to Point B - The Software We Want.
We want to get to Point B within time and budget (maybe other) constraints. This is why we're measuring velocity. 🤯
Guess what? Things change. Point B might move a bit, oscillating between "closer" and "further away" with every passing sprint. That's okay - maybe even a good thing. We can keep an eye on it. We can even forecast that change!
We use relative sized estimates (AKA story points) to size our backlog because they are a self-calibrating mechanism that don't require tweaking if we "get it wrong". If we try to use hours, we end up in weird situations where we achieve "1 hour of work per 8 hours". Embarrassing. Confusing.
We understand speed and how to measure it.
It's not "story points per sprint", but rather "story points per unit of effort". Using "hour of work performed" as the unit is a good resolution.
We know that speed is influenced by some psychological phenomena (y'know, human stuff), some unpredictable occurrences (people becoming sick and taking leave), and some predictable factors (people taking vacation or holiday shutdown periods). The significance of these influence varies wildly. There's also over- and under-time to consider. Those factors would ideally be accounted for in any model hoping to describe the environment and predict the future. We'll try our best.
We want a reasonably high-resolution picture of these things without getting bogged down in the details. Such labour presents diminishing returns. We're spending the minimum time estimating so we can spend the maximum time delivering value.
The aim is to measure with intent. We wanna know when we'll finish. We need to measure the rate of completion of the backlog, and the rate of growth of the backlog. When we have those things, we have (our best guess at) an answer.
We know how to measure those things pretty well by now, so...
Charting The Course
Much like the various tenuous analogies of this extremely long article, we're desperate to know when the project is going to be over.
We can draw two lines representing our predictions for the velocity of progress and the velocity of remaining work, and see where they intersect. That's roughly when we reckon we'll finish.
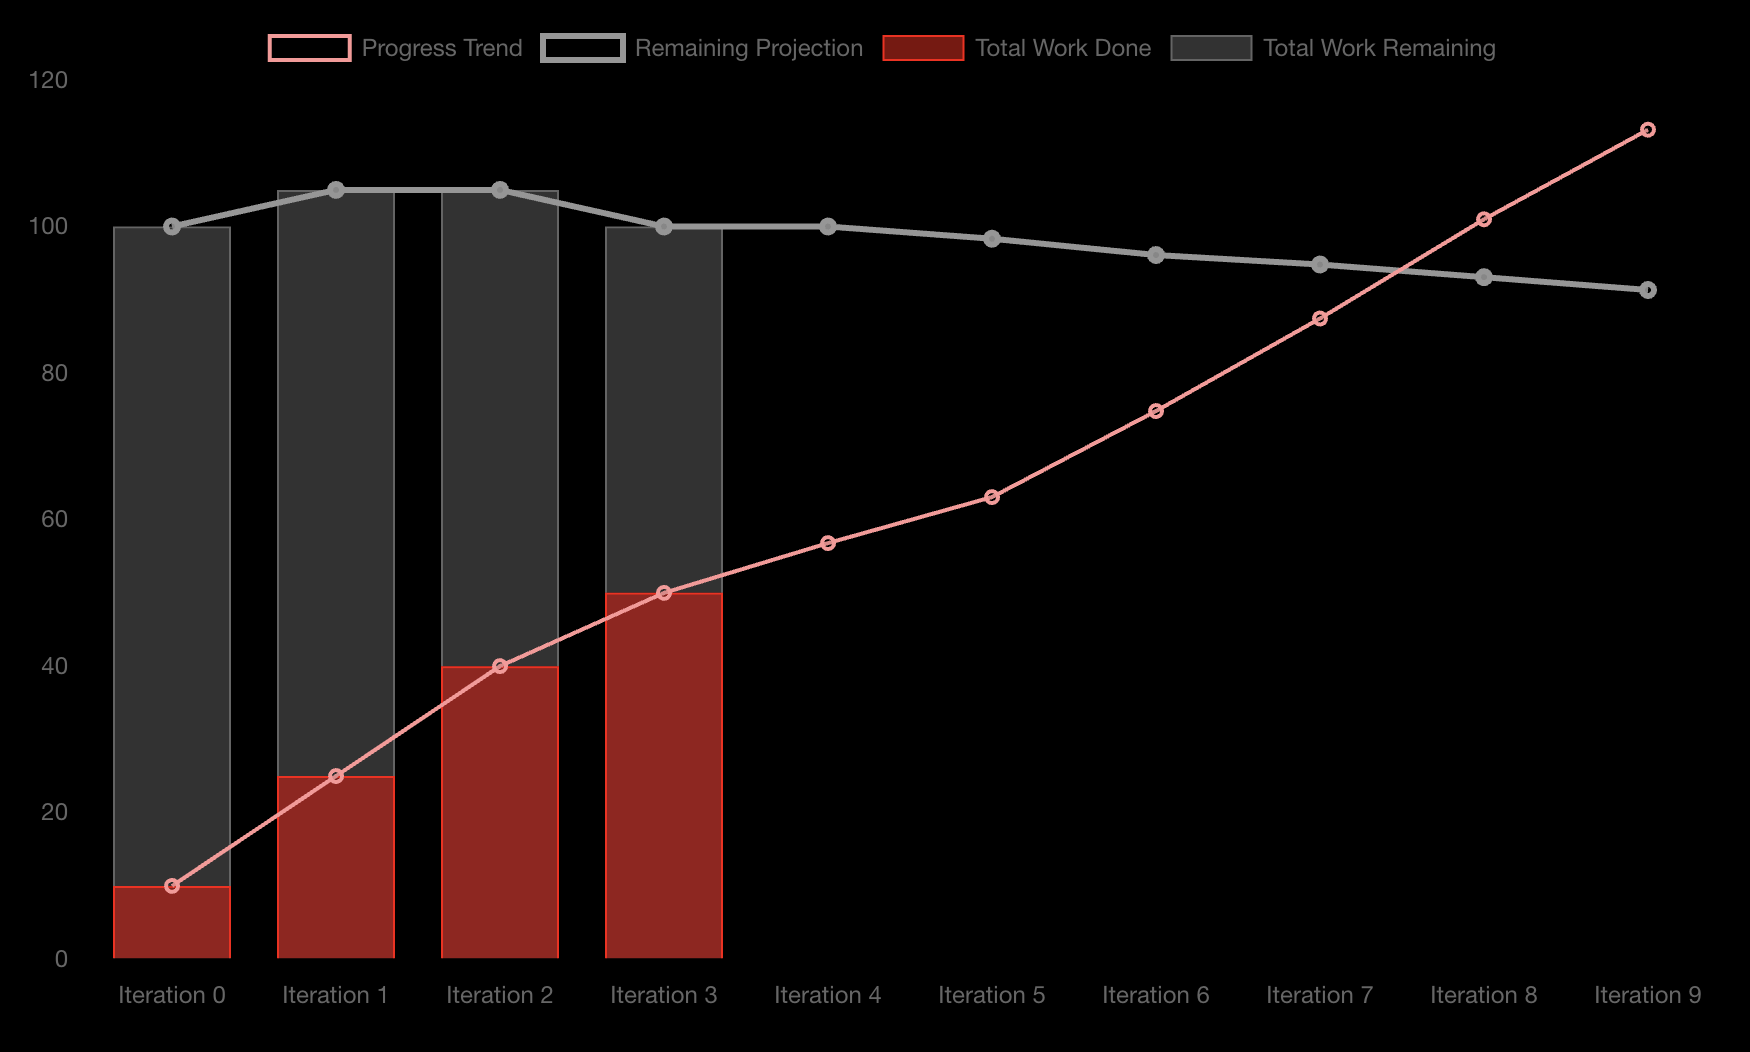
This is a Burn-Up Chart generated using MVPM Tools. It depicts a project with 4 completed iterations (AKA sprints) with an affordance for up to 6 more.
The achievements per iteration are recorded, as well as the amount of work remaining.
Not shown in the image, the team's availability is also recorded, both prospectively and retrospectively (i.e. hours planned for the future, and actual hours from the past).
From this, moving average projections for Progress and Work Remaining are calculated.
We can see that the team has maintained a fairly consistent rate of 10-15 story points per iteration, and the backlog size is trending downwards. Not only are they completing work but they're also reducing scope. Great combination.
The Progress trend factors in availability, projecting a line of:
Story Points Per Hour x Hours Available
per iteration. The lines intersect between Iteration 7 and 8, indicating roughly when they can anticipate the work will be finished if these trends continue.
The moving average periods can be tweaked. If the team decides that the backlog size is likely to remain static from this point forward, they can reduce it to zero.
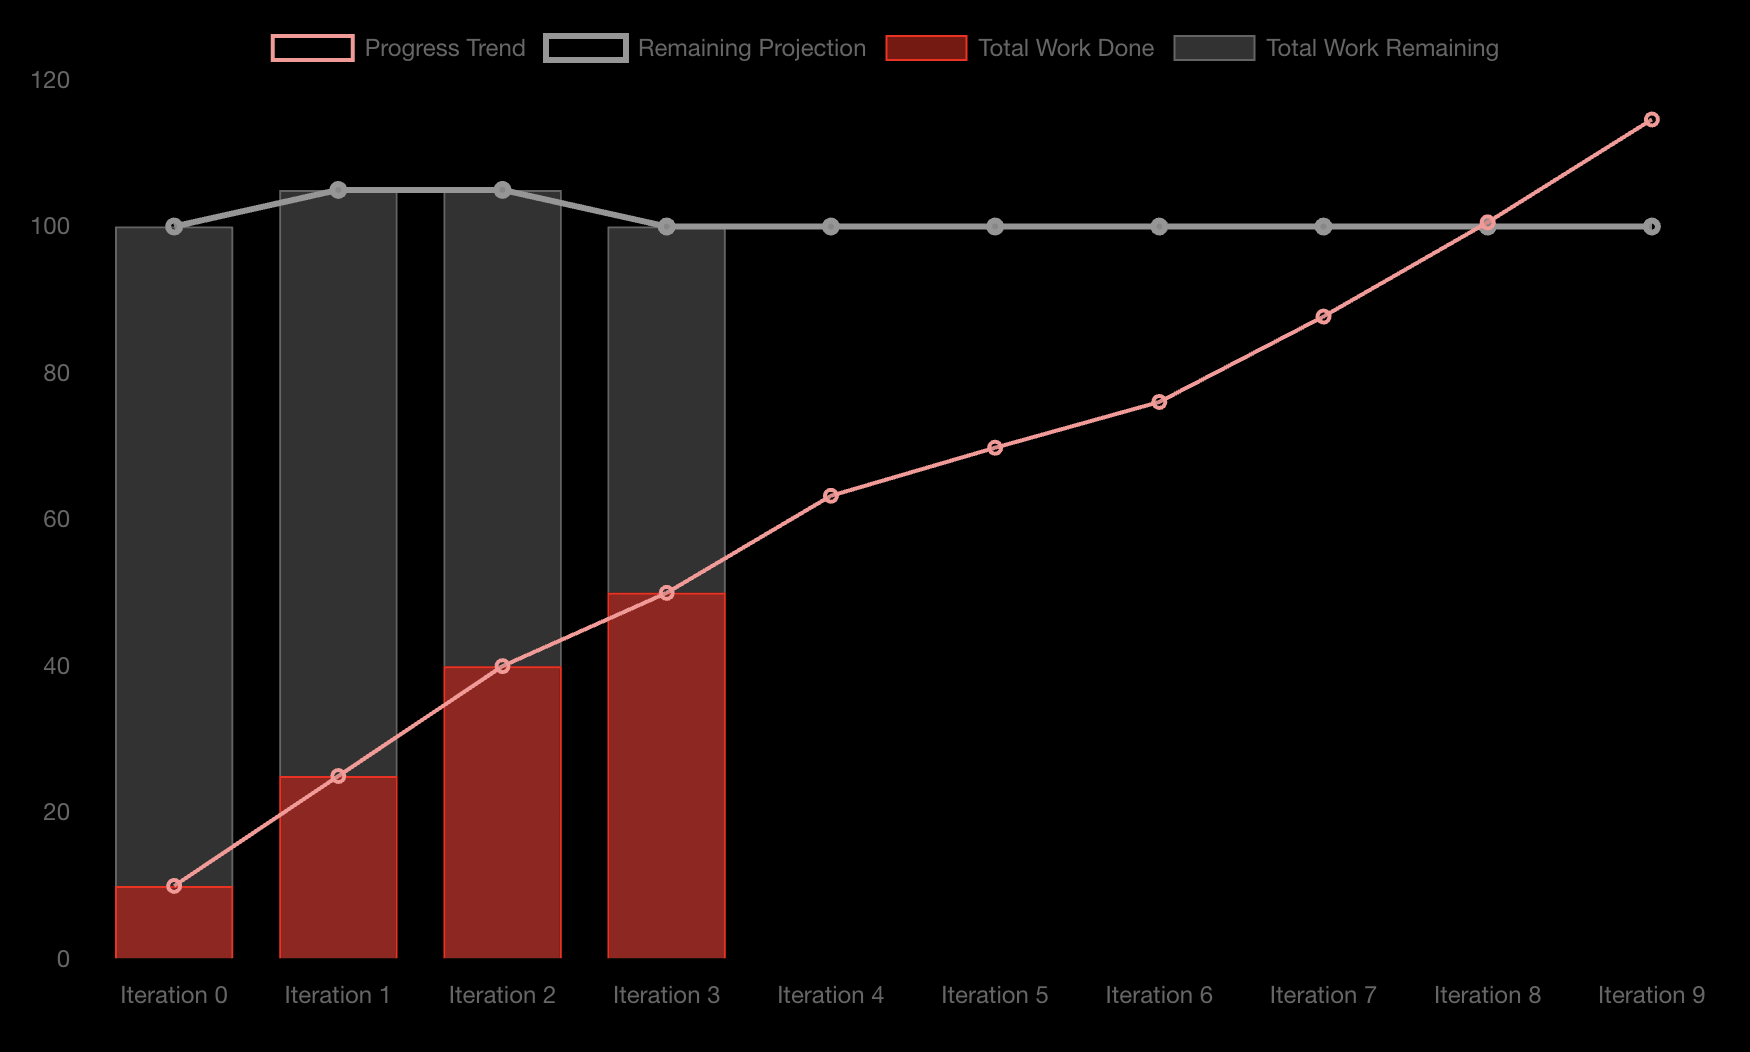
The Remaining Projection trend line now assumes the backlog will henceforth remaing static. The same can be done for the Progress trend line.
Tweaking the moving average periods can help further tweak how this information is advertised, which may be useful if there is "nuance" behind the situation that you feel the stakeholders needn't be concerned with.
📈 Cool, huh? Lines for days.
Closing
We've covered a lot of ground in what is possibly the world's longest thesis on velocity.
There are certainly more variables that could be considered. These are just my thoughts on how best to represent velocity without over-committing to the boring tasks of analysis and data-entry.
I'm hopeful that the story-like presentation has presented information in a somewhat novel (and therefore more retainable) fashion. There are far more concise ways to express this stuff, but sometimes I feel like a leisurely stroll through narrative decadence conveys the message better. Let me know. 🤷♀️
Remember, you can reduce the resolution as much as you like to arrive at something that works for you. Don't wanna track time down to hours? Try days, weeks, whatever. Don't care about the occasional interruption? Don't capture it. Maybe it doesn't matter for your situation. Great! More time for shipping features!
At the end of the day, we're pushing a shape-shifting boulder up and down unsteady terrain. I'd rather spend my energy getting it where it needs to go than refining mathematical models to predict when we'll get there. A thoughtful best-guess will usually suffice.
👋 Happy pushing! 'Til next time.
Appendix
If you made it this far, I hope it was worth it. If not, I can't tell you how sorry I am. As recopmense, here's my take on some residual concerns. I didn't know where else to put them.
Estimating "Non-Development" Work
I often encounter teams struggling with how to estimate non-development work like Design or Business Analysis. In a relative-sizing estimation system, comparing these backlog items and attempting to assign a relative size to each does seem pretty challenging:
- Build doom-scrolling. 5
- Design the landing page. ?
- Ask Byron about the Quarterly Report. ?
If "Build doom-scrolling" is a 5, how big is "Design the landing page"? And how big is "Ask Byron about the Quarterly Report" when everytime I talk to that guy it opens up a can-o-worms? Lol.
Despite all this discourse around software delivery as a non-deterministic artform littered with uncertainty, building software is actually not insurmountably indeterminate.
An experienced developer can usually break down complexity into separate, simpler deliverables. There's still room for unknowns, including the requirements being incomplete or just plain wrong, but it's far from "un-estimatable". After all,
On the other hand, Design work (which I consider to be a superset of UI/UX and BA) is contingent upon a number of very "human" (and therefore unpredictable) factors.
You're often negotiating with an array of psychological, temperamental, intellectual, and bureaucratic challenges (to name a few) in just the requirements gathering alone. Then there's the highly creative aspect of UI and UX.
Some problems have been solved a million times before, and you're almost obligated to plagiarise because reinventing the wheel seems wasteful. Other problems require the miracle of innovation to occur. When will it come? Don't know! What do you do in the meantime? You pump out iteration after iteration of something that'll "probably work, so use that if you must", hoping that a revelation of genius will light up the darkness.
💡 Scratch that. We can turn 10 screens into 1 if we do this one simple trick. Doctors hate me.
Even if you're 5 screens down the 10-screen path, what's the answer gonna be? No? You'd rather build 5 more screens than scrap it all and build 1? Not likely.
This stuff can't easily be estimated, but it's super important to let happen. It produces a better outcome, and can save time and money.
So, here's what I think about estimating it.
Prefer to Estimate Tangible Deliverables Only
The reality is, software delivery is rarely about producing design artifacts. I already made the remark about "We're not here to build backlogs". The same is true for pretty much everything else.
If developers are at least somewhat invested in the Design process (I think they should be), then there's already likely been an influence on the estimates for the corresponding Development work. If that's the case then a backlog item for the Design work only serves as a ticket to be assigned to the worker. Mostly pointless.
My default position is to fill the backlog with User Stories that represent value to a user, to estimate those stories based on their perceived total complexity (including any design considerations the developers might be involved in) and simply absorb the cost of Design work into the ether.
If, by the end of the budget, all the Design work is finished and none of the Development work, no one is going to be happy. On the flip-side, if a half-arsed piece of software that "does the job" is delivered, but the Designer is still putting the finishing touches on "the perfect design", people are probably going to wonder why the Designer even bothered.
Consider the Validity of Tracking Design Hours Worked
In my experience, Designers don't necessarily hang around for the whole lifespan of a project. This might be mere anecdotal evidence, but there's usually "more code to write than pixels to paint", and there seems to be a good chance the developers carry on building features well after they've been designed.
A good Design System left as a parting-gift to a Development team who came along with the journey might just be enough to cover off any remaining surprise requirements that haven't been put on canvas yet.
As such, designers tend to "taper off" a project, winding down from a 5-day week to something like 2 days per sprint to sprinkle a little magic (but mainly just to keep the developers accountable). 😜
So, if designers do indeed end up leaving the project, that means that our total "Hours Worked Per Sprint" is going down. If that's a parameter of our Velocity calculations, then we need to consider how that affects Velocty projections. Spoiler alert, it breaks them!
Different Types of Deliverables? Different Backlogs.
If design artifacts really are a tangible deliverable along with running software, there's still no sensible way to estimate Design work relative to Development work. It's hard enough estimating Design work as it is. It's not even Apples and Oranges. It's like... Apples and Goannas, or something.
A team of developers might be incapable of collectively producing a single tolerable UX (hopefully not, but... y'know). Similarly, a gang of designers might be incapable of producing Fizz buzz. If you ask a developer to take on a 5-point Design backlog item, you'll probably find it takes them longer than coding the doom-scrolling feature.
Don't try to combine the two very different work types. If you must track velocity for both, have a backlog for Design and a backlog for Development.
What's left is to maintain that "iterative mindset" so that Development work can proceed with "good enough" designs while the latent genius is brewing.
The End... for real this time.